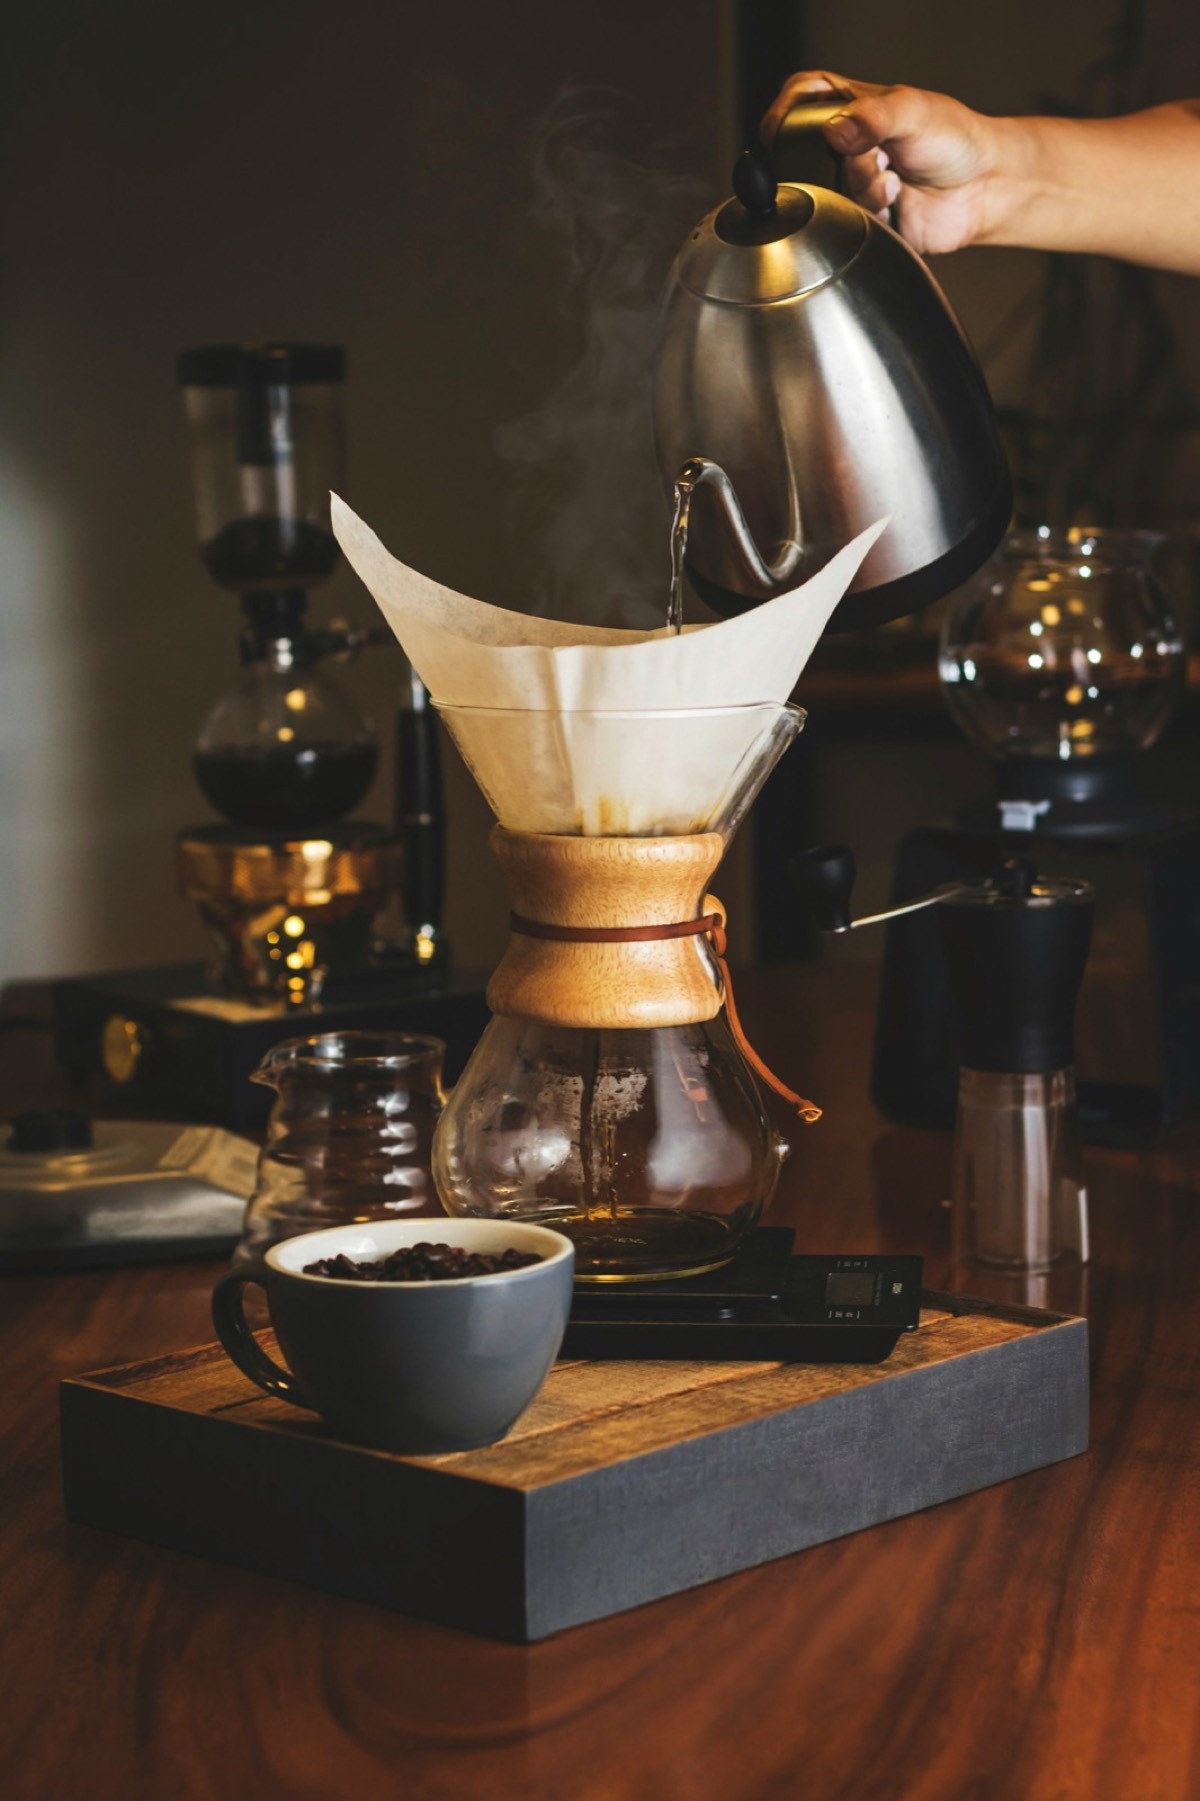
A brewed coffee is about 98–99 % water by mass, which makes the mineral content of that water a reagent rather than a backdrop. Two identical doses of the same roast, brewed at the same 1:15 ratio and the same 93 °C, can land in visibly different cups when one is made with soft, low-alkalinity water and the other with hard tap water carrying a heavy bicarbonate load.
The workable way to read brewing water is as four numbers — total hardness, alkalinity, pH and total dissolved solids — plus a short list of things that should sit at or near zero. Below are the target ranges, what each number does during extraction, and how to measure or assemble water that lands inside them.
Four numbers, and the ranges to aim for
Brewing water for coffee is usually specified as a band rather than a single value:
- Total hardness: 50–175 ppm as CaCO₃ [1][9]
- Alkalinity: 40–70 ppm as CaCO₃ [1]
- pH: 6.5–7.5 [9]
- Total dissolved solids: 75–250 ppm [1][9]
- Chlorine: 0 [1]
Two unit notes save a lot of confusion. At the concentrations found in drinking water, 1 mg/L and 1 ppm are the same number, so a municipal report written in mg/L needs no conversion. Hardness and alkalinity are both commonly reported in calcium-carbonate equivalents even though they measure different things: hardness counts dissolved calcium and magnesium, alkalinity counts the bicarbonate and carbonate that buffer the water. A report that gives you "hardness 140" and "alkalinity 210" is describing two properties of the same sample, not two names for one.
Hardness and alkalinity pull in different directions
Hardness is the mineral load. It comes from calcium and magnesium dissolved as the water moved through rock, and it is what deposits scale in a kettle, a boiler and a steam wand at the high end of the range. Coffee extraction also depends on it: dissolve minerals are part of what the water brings to the bed, and a supply near the bottom of the 50–175 ppm band behaves differently from one near the top even when both are "soft enough" on a household scale [1].
Alkalinity is the buffer. Bicarbonate and carbonate neutralise acids, and coffee acids are a large part of what a drinker describes as brightness and fruit. Inside the 40–70 ppm band there is enough buffering to keep the cup from tasting thin without flattening it. Above that band the buffer works against the coffee's own acidity, and the same beans can read as dull or papery. Below it, the water has little capacity to resist pH change and the brew can taste sharp and hollow [1].
That is why the two numbers have to be read separately. A water can be low in hardness and high in alkalinity — common with softened or some surface supplies — and it will still mute the cup. The hardness figure alone will not warn you.
How the two bands interact matters more than either figure alone, and the pairing that reads best is the hard end of 50–175 ppm against the low end of 40–70 ppm: enough mineral to carry structure, little enough buffer to leave the roast's acids audible [1][2]. When a coffee goes flat on a recipe that worked a month ago, check alkalinity before you touch the grinder setting.
What the dissolved cations change
Published work on coffee extraction water compared how different dissolved cations behave and found that the mineral profile of the water changes what comes out of the grounds, not only how much material the water already contains [2]. The ions carry charge and interact with the acids and other soluble compounds in coffee; sodium, calcium and magnesium do not sit in the same role.
For a home brewer the consequence is concrete: a conductivity meter reporting 120 ppm cannot tell you whether that 120 ppm is calcium, magnesium or sodium, and the three behave differently in the brew. Matching a TDS reading to the 75–250 ppm band is a coarse check on total load, not a statement about water chemistry [1][2].
What hot water actually takes out of the grounds
The material that hot water lifts from roasted coffee is not a single substance. A characterisation of the high-molecular-weight fraction extracted with hot water from roasted arabica found it dominated by polysaccharides — large carbohydrate molecules that contribute body and mouthfeel rather than aroma [3]. Those compounds need water as the solvent; there is no way to extract them into a dry bed.
The solvent itself has physical properties that matter. Water's relative permittivity, close to 80 at 20 °C, is high enough to keep polar coffee solutes dissolved and to shift how some of them pair up in solution, which is the mechanism behind work on the dimerisation of organic molecules in brewed coffee [4]. Separately, a study of brewing methods found measurable differences in the mineral content of the resulting beverage depending on how it was brewed, meaning the water you pour contributes calcium, magnesium, potassium and sodium to the cup rather than vanishing into it [5]. Cyclic-voltammetry work on black coffee quality makes the same point from another direction: the dissolved fraction of a brew is electrochemically active and can be profiled directly from the liquid [6].
Reading the water you already have
Start with the supplier's own data. Municipal water reports list calcium and magnesium in mg/L and alkalinity as CaCO₃, which maps straight onto the two bands above. If the report shows hardness at 220 ppm and alkalinity at 180 ppm, both figures sit outside the brewing range and the water will need treatment before it does the coffee justice [1].
A cheap TDS or conductivity pen is a secondary tool, not a substitute. It counts everything dissolved — minerals, but also the chloride, sulphate and nitrate that have no brewing role — and it infers solids from electrical conductivity, so it cannot separate hardness from alkalinity. Use it to confirm that a filter or a blend is changing the water, and use titration or the supplier's report to get the two numbers that actually drive extraction [1].
Reverse osmosis sits at the opposite extreme from hard tap water. It strips essentially all dissolved minerals, leaving water well below the 75–250 ppm band, so an RO supply for coffee is normally rebuilt: a small amount of mineral concentrate is added back until hardness, alkalinity and TDS land inside the target ranges [1]. Softened water is a third case: ion exchange replaces calcium and magnesium with sodium, so the hardness number falls while the sodium content rises and alkalinity may not move at all.
Bottled-water labels are the fastest reference point on a shop shelf: most print calcium and magnesium in mg/L, sometimes next to bicarbonate. Those lines let you place a bottle against both bands. A label that gives only total dissolved solids does not, because that figure sums every dissolved ion without saying which ones are present [1][2].
Holding water still while you change everything else
Water is the one variable most home brewers leave uncontrolled while they chase grind and ratio, and that turns a dial-in into guesswork. Fix the water first, then tune the rest against it. Brewing water for coffee is held at 92–96 °C, and the measured espresso protocol in the literature ran at 92–94 °C; a kettle and brewer that stay in those values give the coffee a stable thermal starting point [1][7]. The same applies at the cupping end: the standard cupping dose of 8.25 g per 150 mL, about 1:18, assumes a defined water, and its results are only comparable when that water is held constant [8].
If you buy bottled water for brewing, read the label for the two figures that matter — calcium and magnesium, and bicarbonate — and compare them against the 50–175 ppm hardness and 40–70 ppm alkalinity bands rather than against the brand's marketing. If you build water from RO or distilled stock, dose minerals until the same two numbers fall inside those bands and the TDS lands between 75 and 250 ppm [1]. Then leave the water alone for the whole dial-in, and change one brewing variable at a time against a fixed baseline.
Method: The ranges and process values on this page are taken from the peer-reviewed studies listed at the end, each read for the specific figure quoted beside it.
Boundary: The figures describe what dissolved minerals do to extraction and how a household supply can be measured, compared against a target band and adjusted. They cover the water side of the brew; the coffee, the grinder and the recipe determine the rest of the cup.
- Choi J, Lee J — Cross-Cultural Comparison of the Espresso Protocol Repeatability, Foods 14(4):593, 2025; Tables 2–3 give the brewing-water specification and the espresso protocol temperatureaccessed 2026-09-12
- Hendon CH, Colonna-Dashwood L, Colonna-Dashwood M — The role of dissolved cations in coffee extraction, Journal of Agricultural and Food Chemistry 62(21):4947–4950, 2014accessed 2026-09-11
- Nunes FM, Coimbra MA — Chemical characterization of the high molecular weight material extracted with hot water from green and roasted arabica coffee, Journal of Agricultural and Food Chemistry 49(4):1773–1782, 2001accessed 2026-09-11
- Bradley ES, Hendon CH — The impact of solvent relative permittivity on the dimerisation of organic molecules well below their solubility limits: examples from brewed coffee and beyond, Food & Function 8(3):1037–1042, 2017accessed 2026-09-11
- Influence of Brewing Methods on the Bioactive and Mineral Composition of Coffee Beverages, Molecules 30(20):4080, 2025accessed 2026-09-11
- Bumbaugh RE, Pennington DL, Wehn LC, Rheingold EJ, Williams JR, Alemán BJ, Hendon CH — Direct electrochemical appraisal of black coffee quality using cyclic voltammetry, Nature Communications 17:3618, 2026accessed 2026-09-11
- Batali ME, Ristenpart WD, Guinard J-X — Brew temperature, at fixed brew strength and extraction, has little impact on the sensory profile of drip brew coffee, Scientific Reports 10:16450, 2020; quotes the SCA Coffee Brewing Handbook range of 92–96 °C for brewing wateraccessed 2026-09-12
- Does Coffee Have Terroir and How Should It Be Assessed?, Foods 11(13):1907, 2022accessed 2026-09-11
- Santanatoglia A, et al. — Discrimination of Filter Coffee Extraction Methods of a Medium Roasted Specialty Coffee Based on Volatile Profiles and Sensorial Traits, Foods 12(17):3199, 2023; gives the recommended pH range for brewing water (6.5–7.5), hardness 50–175 ppm and dry residue 75–250 mg/Laccessed 2026-09-12
The fastest order of work is to read your supplier's calcium, magnesium and alkalinity figures, compare them with the two ppm bands, and only then decide whether the water needs filtering, blending or remineralising. Once the water sits in range on paper, keep it there and tune grind and ratio against it; a supply that moves from week to week will keep resetting the recipe you just dialled in.