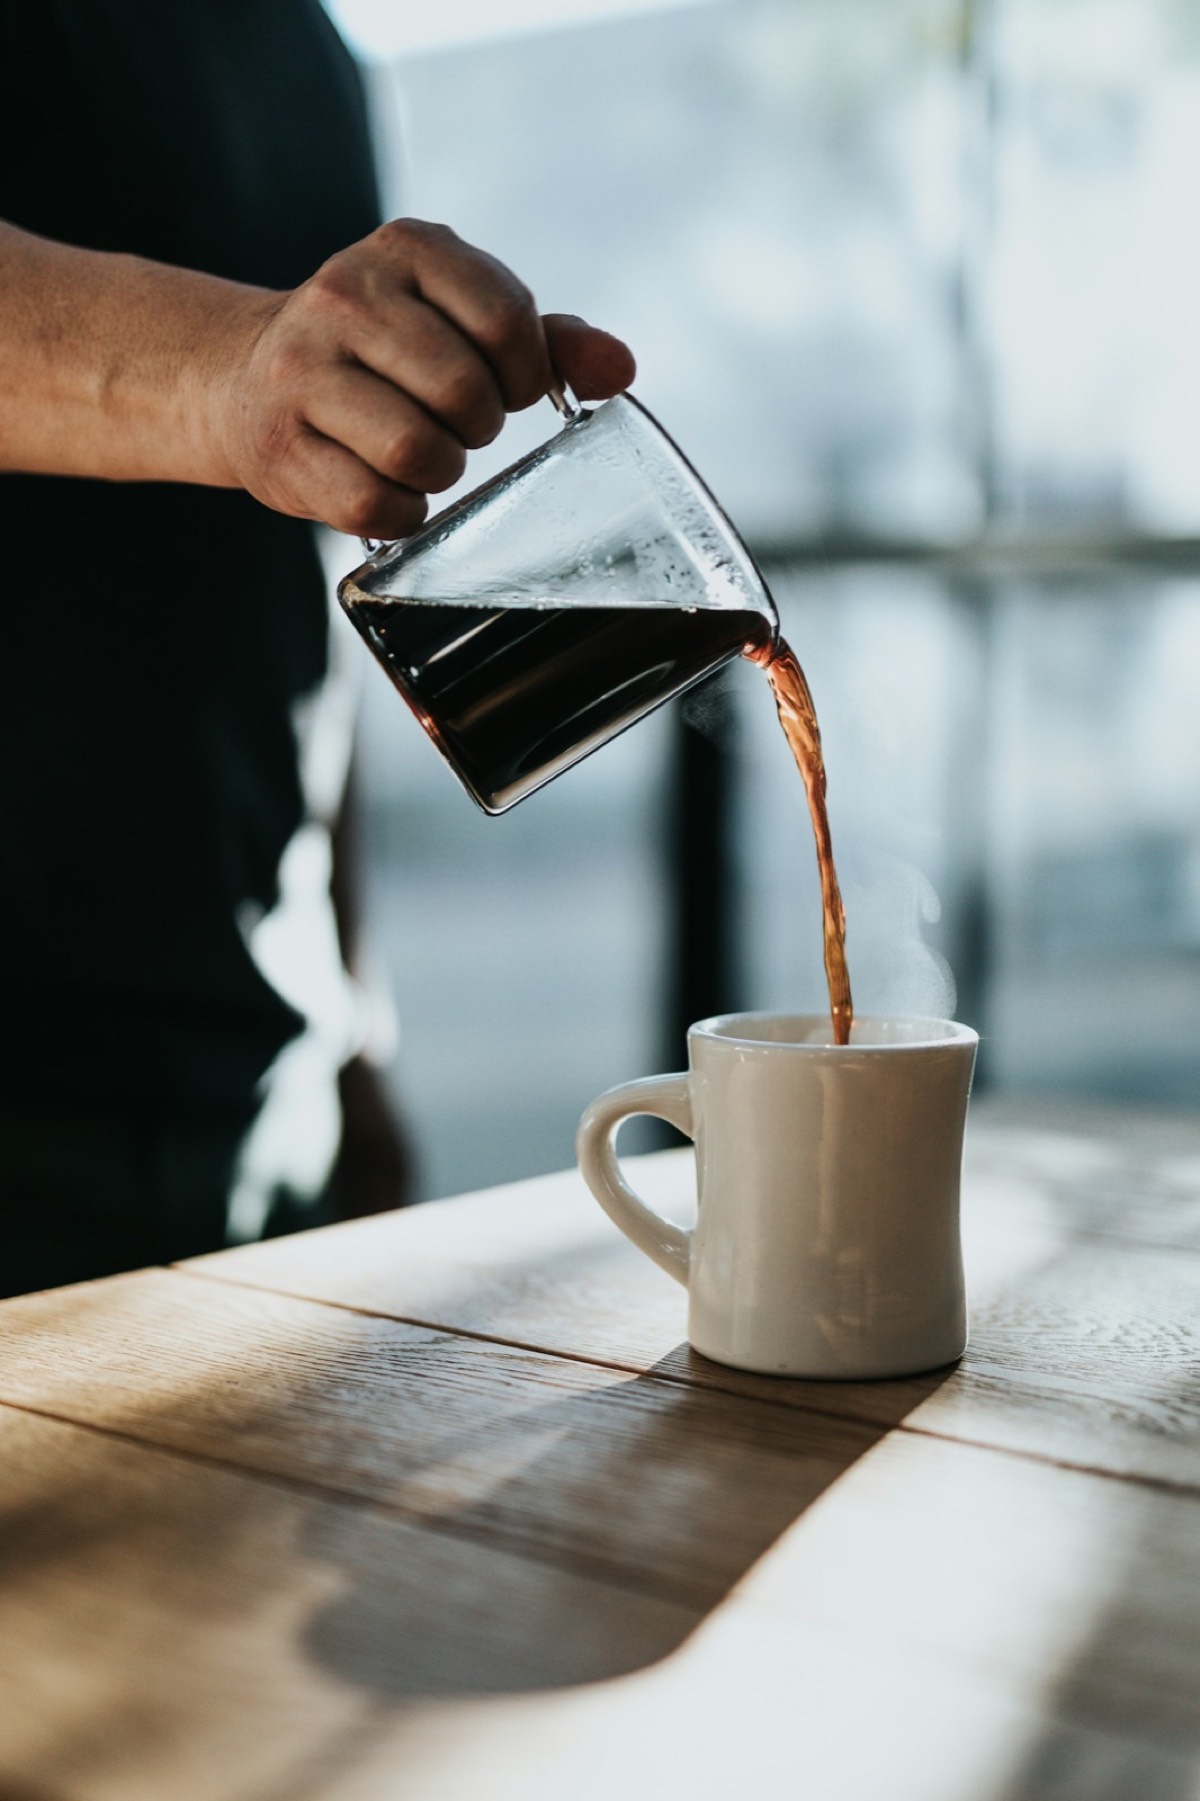
A pour-over is a gravity brew, so every adjustment you make shows up as a change in how fast the water leaves the bed. That makes it easier to dial in than it feels: if you record three numbers per brew and change only one setting between brews, the brewer tells you what it did.
The sequence below fixes the variables in the order that removes guesswork — dose and ratio first, then extraction targets, then grind, then temperature and time — with the numeric ranges attached to the sources at the end.
Fix the three numbers you can measure
Weigh everything. A scale reading to 0.1 g gives you dose, poured water and beverage mass, and those three numbers turn a brew from a taste memory into a record. Volumetric scoops and kettle markings are the single largest source of drift in a home pour-over because ground coffee density changes with roast level and grind setting.
A pour-over ratio is written as one part coffee by mass to a set number of parts water. The published protocols cited below use single figures rather than a range: 1:15 in the V60 protocol, and a slightly weaker 1:16.6 in the automated-filter protocol of the same body of work, stated as 60 g of coffee per litre of water [1]. Pick one ratio, write it down, and hold it for the whole dial-in; the ratio is the frame the other variables hang on.
Extraction yield and brew strength are two separate targets
Two numbers describe what a brew actually did. Extraction yield is the share of the dry coffee mass that ended up dissolved in the cup; brew strength is the concentration of that dissolved material in the liquid. For filter coffee the working targets are an extraction yield of about 18–22 % and a brew strength of roughly 1.15–1.35 % total dissolved solids [2][3].
They are not the same measurement, and the arithmetic that links them is short. Multiply brew strength by the mass of the beverage, divide by the dose, and you have the extraction yield. A 15 g dose producing 250 g of coffee at 1.30 % TDS works out to 21.7 % extraction — inside the target band. Change the ratio so the same dose yields 300 g at 1.15 % and the yield sits at 23 %, which tells you the brew was pushed further even though the cup tastes weaker [2][3]. A refractometer gives you the strength reading directly; without one, beverage mass and brew time are the two proxies you can still log.
Two brews can hit the same extraction yield and still be different drinks, which is why the target is a rectangle rather than a single line. A 1.20 % brew at 20 % extraction is lighter on the palate than a 1.45 % brew at the same 20 %, and that gap comes from the ratio and the beverage mass rather than from the extraction itself [1].
Grind size in microns, and the fines that set the drawdown
The published classes divide pour-over coffee from the bands on either side of it: fine runs 300–600 µm, medium 600–800 µm, and anything coarser than 800 µm counts as coarse, with pour-over sitting at the top of the fine band — the setting a dial-in starts from [4]. On most hand grinders that is between four and six clicks from the espresso range, and the exact number is specific to the burr set rather than to the coffee.
The average particle size is only half the story. Espresso and filter beds both carry a fines fraction — particles below about 100 µm produced by the grinder — and in measured extraction dynamics the drain time tracks the dust fraction rather than the mean particle size [5]. That is why two grinders set to the same nominal setting can produce different drawdown times on the same coffee: they differ in how much dust they make, not only in where the median sits.
Two further effects are worth knowing before you blame your technique. Grinding changes particle distribution as the burrs warm up, and the origin of the bean itself shifts the distribution at a fixed setting, so the same grinder on a light Ethiopian and a darker Brazilian does not deliver one identical grind at one number [6].
| If the drawdown is | The likely cause | The one change to make |
|---|---|---|
| Much faster than 2:30 and the cup tastes thin or sour | Bed too coarse, or too much channel through it | Grind one step finer |
| 3:00–4:00 with even extraction and a balanced cup | Bed matched to the pour | Leave the grind alone |
| Slower than 4:00 with bitterness or astringency | Too many fines or too fine a median | Grind one step coarser, or pour in smaller pulses |
Temperature, bloom and the time budget
For coffee brewing the water-temperature band is 92–96 °C, and the published V60 protocol runs at 93 °C, so a setting near the middle of that band is a defensible default rather than a guess [1][2][3]. A measured espresso protocol uses 92–94 °C, which is the same thermal window applied to a different brewer [7]. If your kettle has no readout, the number to watch is the temperature in the slurry, not the number on the display after the pour begins.
The bloom exists to release carbon dioxide before the main pour. Wet the grounds with roughly two to three times their mass in water, wait 30–45 seconds, and the bed stops bubbling and settles. For a 15 g dose that is 30–45 g of water at the start. Total contact time for a pour-over in the published protocols sits in the 3–5 minute range, with the steeped portion of the schedule accounting for most of it [3][4]. The 2:30–4:00 window shown in the table above is a useful working band for a single-cup cone: fast enough that fines do not over-extract, slow enough that the coarse particles give up their acids.
Read the drawdown before you change the recipe
Brew time is the cheapest diagnostic you have. A bed that drains far too fast is under-extracting — the water passes the coarse particles and leaves the soluble material behind — and the cup will read sour or weak before it reads strong. A bed that stalls has the opposite problem: fines have collected at the filter and the water keeps extracting the same particles, which shows up as bitterness and a drying finish.
Change one variable, not the whole recipe. If the cup is sour and the drawdown was quick, grind one step finer and keep the ratio, the dose and the temperature identical. If the cup is bitter and the drawdown was slow, grind one step coarser at the same dose. Keep the temperature fixed while you solve grind, because raising temperature and fining the grind in the same brew makes the two effects indistinguishable. The dose sets how much you drink and how much coffee you spend; move it only after grind and temperature are settled.
The drawdown is a readout of everything upstream of it: grind, paper, bed depth and pour pattern. Two grinders producing the same median particle size can still empty the same cone at different speeds, because the share of particles below 100 µm differs between them [4]. That is why changing grinders can force a new recipe even when the dial reads the same number as before.
A dial-in order you can repeat
- Set the dose and the ratio. Pick a dose of 15–20 g and one ratio — the cited V60 protocol is written at 1:15 — and write both down [1].
- Set the temperature. Keep the kettle inside the 92–96 °C band, taking 93 °C as the published protocol's default [1][2][3].
- Choose a starting grind. Medium-fine, inside the 600–800 µm class, on a grinder you have just zeroed [4].
- Bloom and pour. Two to three times the dose in water, 30–45 seconds of bloom, then the remaining water in pulses.
- Record the numbers. Dose, poured water, beverage mass and total time, every brew.
- Change one thing. Grind is the first lever; if the cup is close but not right after two grind steps, move the temperature by one or two degrees before you touch the ratio.
- Check the targets. With a refractometer, confirm brew strength against 1.15–1.35 % TDS and extraction against 18–22 %; without one, use beverage mass and time as the proxies [2][3].
Keeping a written record is what separates a dial-in from a series of experiments. Three fields — dose, beverage mass and time — are enough to reconstruct what a good brew did, and enough to recognise the day a different bag of coffee quietly changed the answer.
Method: The dial-in order on this page is built from the brewing studies listed at the end: extraction-yield and strength targets, particle-size classes in micrometres, water-temperature ranges and measured drawdown behaviour, with each figure tied to the source beside it.
Boundary: The sequence applies to gravity-fed pour-over brewers with a paper filter and a scale that reads to 0.1 g. It describes how the listed variables move extraction; the coffee and the grinder you own set where inside those ranges your recipe sits.
- Discrimination of Filter Coffee Extraction Methods of a Medium Roasted Specialty Coffee Based on Volatile Profiles and Sensorial Traits, Foods 12(17):3199, 2023accessed 2026-09-11
- Batali ME, Ristenpart WD, Guinard J-X — Brew temperature, at fixed brew strength and extraction, has little impact on the sensory profile of drip brew coffee, Scientific Reports 10:16450, 2020; quotes the SCA Coffee Brewing Handbook range of 92–96 °C for brewing water and the Golden Cup Standard targets of 18–22% extraction at 1.15–1.35% TDSaccessed 2026-09-12
- Does Coffee Have Terroir and How Should It Be Assessed?, Foods 11(13):1907, 2022accessed 2026-09-11
- Analysing extraction uniformity from porous coffee beds using mathematical modelling and computational fluid dynamics approaches, PLOS ONE 14(7):e0219906, 2019accessed 2026-09-11
- The role of fines in espresso extraction dynamics, Scientific Reports 14:5555, 2024accessed 2026-09-11
- Uman E, Colonna-Dashwood M, Colonna-Dashwood L, Perger M, Klatt C, Leighton S, Miller B, Butler KT, Melot BC, Speirs RW, Hendon CH — The effect of bean origin and temperature on grinding roasted coffee, Scientific Reports 6:24483, 2016accessed 2026-09-11
- Cross-Cultural Comparison of the Espresso Protocol Repeatability, Foods 14(4):593, 2025accessed 2026-09-11
A dial-in that holds is one where every change is written down next to the number it moved. Record dose, beverage mass and drawdown time for each attempt, change a single variable, and keep the attempt that hits the 18–22 % extraction band with a cup you want to drink again.