In a tasting note, acidity is a compliment and sourness is usually a complaint, and both words are applied to the same sensation. What separates them in a laboratory is not intensity but which quantity was measured: acidity in coffee is described either by pH or by titratable acidity, and these two numbers move independently.
A cup can sit at an ordinary pH while tasting sharp, or read low on the pH scale while tasting round. Understanding why starts with what each measurement actually does.
pH and titratable acidity measure different things
pH reports the activity of free hydrogen ions on a logarithmic 0–14 scale, so one unit is a tenfold change. Brewed coffee typically sits between pH 4.8 and 5.2: more acidic than milk, far less acidic than lemon juice.
Titratable acidity is a different experiment. A sample is titrated with a base — commonly 0.1 M sodium hydroxide — until the indicator reaches an endpoint around pH 8.1–8.2, and the volume of base consumed is converted into an acid equivalent, often milligrams of citric acid per 100 mL.
- pH — free hydrogen ion activity, logarithmic; brewed coffee commonly falls in the 4.8–5.2 band.
- Titratable acidity — total acids available for neutralisation, measured by titration to a defined endpoint and expressed as an acid equivalent.
- Endpoint — the pH at which titration stops; the same sample reported against a different endpoint gives a different titratable acidity figure.
- Buffering — coffee's dissolved solids resist pH change, which is why adding acid moves titratable acidity more than it moves the pH reading.
Why a lower pH does not mean a sourer cup
Because pH is logarithmic, small numeric differences are large chemical ones: a shift of 0.2 pH units is a 1.58-fold change in hydrogen ion concentration, even though a drinker would call both cups normal. Samples reading 5.0 and 5.2 are not described as different in kind by anyone tasting them.
The acids themselves are also perceived differently at equal concentration. Citric acid reads as a sharp, citrus-peel sourness; malic acid reads rounder and more apple-like; lactic acid is milder still; acetic acid at the same level reads vinegar. Titratable acidity adds all of them into one figure, so a coffee can measure high on total acids and still taste balanced if most of that total sits in the milder acids.
What tasters call balance is therefore a relationship among three quantities: total acids, sweetness and body. Raise sweetness at a fixed acid level and the same cup reads juicy rather than sharp; take body away and the same acids read thin and sour.
The acids in coffee and where they come from
Coffee contains a family of organic acids rather than one, and where each comes from decides how roast and process move it.
- Chlorogenic acids — the largest acid group in the green bean, reported at roughly 5–10% of dry mass, and generally higher in robusta than in arabica.
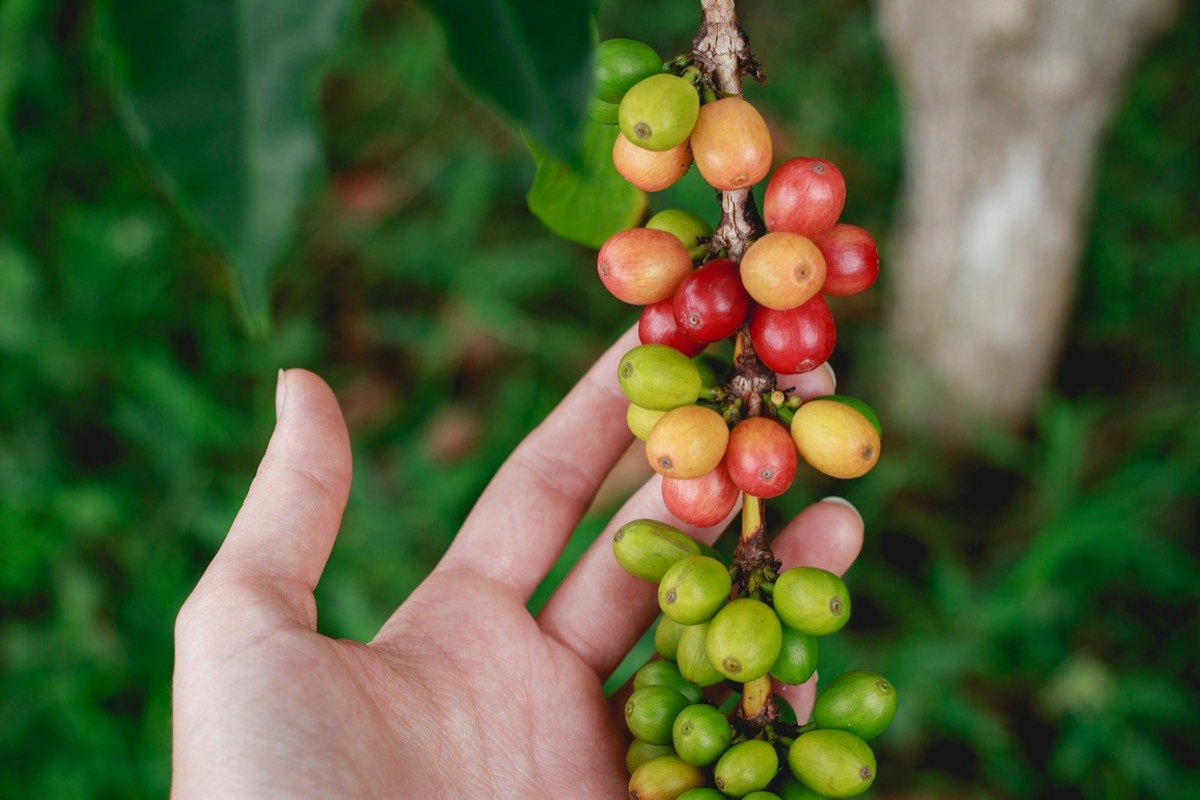
- Citric and malic acid — present in the seed itself, and the two most closely tied to the bright, fruit-adjacent acidity of washed high-grown coffees.
- Acetic and lactic acid — produced during fermentation and drying; their share rises with longer or warmer fermentations.
- Quinic acid — formed mainly during roasting as chlorogenic acids break down, so its contribution grows with roast degree.
- Phosphoric and formic acid — minor contributors by mass, and part of the reason pH and perceived sourness can disagree.
Because the mix differs, origin and process words are also acid words. A washed coffee from a high-altitude site tends to carry more of the bean-original acids, while a long-fermented or sealed-fermentation lot tends to carry more of the fermentation acids.
Roast degree moves the acid profile
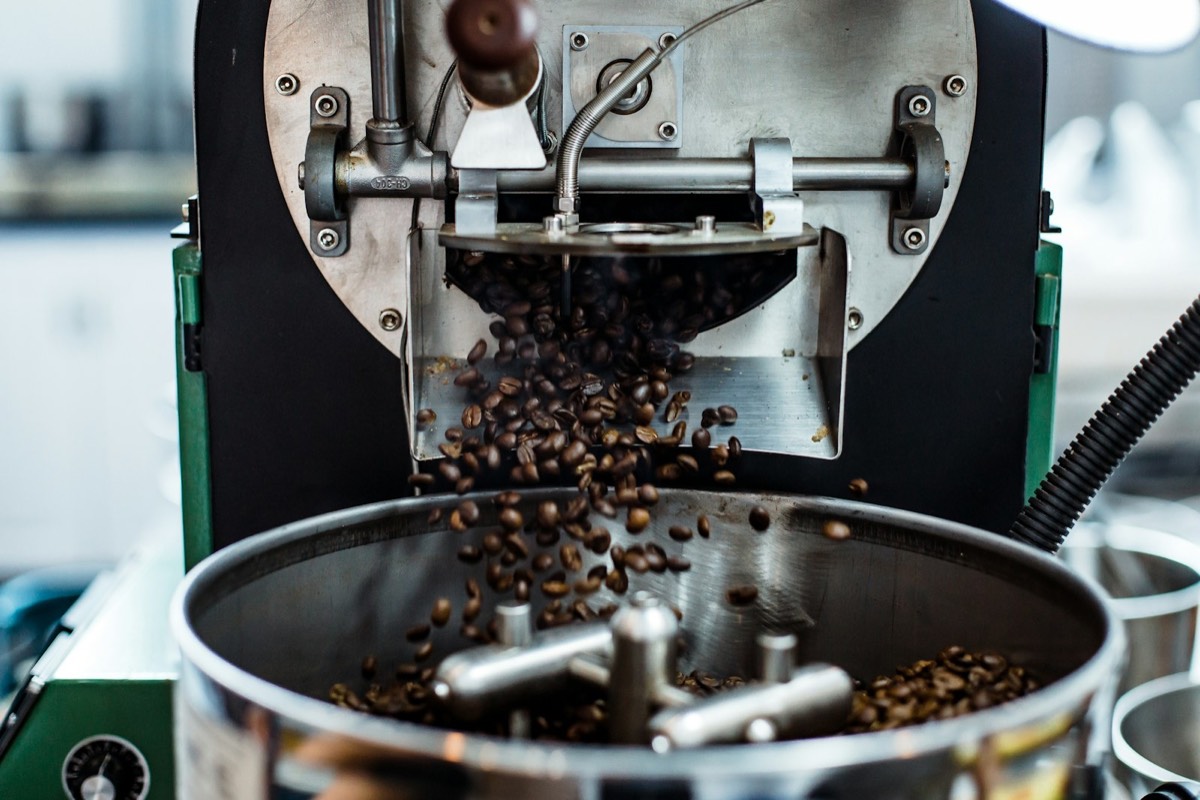
Roasting does not simply reduce acidity; it redistributes it. Chlorogenic acid content falls steeply as the roast progresses, losing roughly half to two-thirds of its original value by the dark end, and quinic acid rises as that degradation product accumulates. The bean's stored sugar is largely gone by the time the roast reaches a medium colour.
The sensory result of that trade is not a straight line. A light roast can carry high total acids alongside high sugar, which reads as bright and sweet; a dark roast can carry lower total acids but a larger share of quinic and acetic acid, which reads as drying and faintly sour at the finish. That is one reason "less acidic" and "less sour" are not the same claim about a dark roast.
Temperature in the cup matters as well. Perception of sourness and bitterness shifts as a brewed coffee cools, so the same sample can be scored differently at 60 °C and at room temperature.
Descriptive language: acidity as a score, sourness as a fault
In professional assessment the two words are separated by the form itself. The SCA cupping form scores acidity as one attribute among several within a 100-point scheme, and a total score above 80 defines specialty coffee. Sourness, by contrast, is recorded as a defect note, usually with modifiers such as acetic, fermenty or phenolic.
The vocabulary layers under each score:
- Acidity descriptors — bright, citric, malic, tartaric; used when the acid impression is integrated with sweetness and body.
- Sourness descriptors — sour, vinegary, fermenty, green; used when the acid impression stands apart from the rest of the cup.
- Temperature — scoring a sample from hot to cool is standard practice precisely because the balance between acidity and sweetness changes over that range.
Controlled comparisons support the split between compounds and sensation. In a full-immersion brewing study, cold brew was rated less bitter and less sour than the equivalent hot brew, and the difference tracked volatile and acid profile changes rather than any change in total dissolved solids.
Method: The measurements described here are the ones used in coffee chemistry and sensory work — pH by meter, titratable acidity by titration to a defined endpoint, the acid families identified by chromatography, and the attribute scores from the standard cupping form — taken from the standards and studies listed at the end.
Boundary: These figures describe what is in a brewed sample and how instruments and trained panels report it. The word a given drinker reaches for, bright or sour, depends on concentration, temperature and the rest of the cup.
- Specialty Coffee Association — Coffee Standardsaccessed 2026-09-11
- Validation of the Coffee Cuality™ Method for the Expert Assessment of Coffee Sensory Quality — Foods (MDPI) 15(4):678, doi:10.3390/foods15040678; reports the SCA/Q-grading cupping protocol and 100-point scoring scheme cited here, full text via Europe PMC RESTaccessed 2026-09-12
- Changes in Short- and Medium-Chain Fatty Acids and Sugars During Kombucha Fermentation of Tea and Coffee Byproducts and Their Relation to Sourness — Foods (MDPI), doi:10.3390/foods15122074accessed 2026-09-11
- Sensory Analysis of Full Immersion Coffee: Cold Brew Is More Floral, and Less Bitter, Sour, and Rubbery Than Hot Brew — Foods (MDPI), doi:10.3390/foods11162440accessed 2026-09-11
- Does Coffee Have Terroir and How Should It Be Assessed? — Foods (MDPI), doi:10.3390/foods11131907accessed 2026-09-11
- Influence of Brewing Methods on the Bioactive and Mineral Composition of Coffee Beverages — Molecules (MDPI), doi:10.3390/molecules30204080accessed 2026-09-11
- Cross-Cultural Comparison of the Espresso Protocol Repeatability — Foods (MDPI), doi:10.3390/foods14040593accessed 2026-09-11
Read the acid words on a menu as directions on a map rather than as a scoreboard. When a coffee tastes sharp, the useful next question is which measurement would move: raise the brew ratio to soften concentration, check the roast date, and find out what process the lot went through before treating acidity itself as the problem.